China Vape Trade Data Report for November: Trade With 125 Partner Countries, Top 20 Account for Tota
 2FIRSTS analyzed China's November 2023 customs data report, using "key figures" to observe monthly changes and present a series of noteworthy trends in e-cigarette export trade.
Editor’s note: 2FIRSTS analyzed China's November 2023 customs data report, using "key figures" to observe monthly changes and present a series of noteworthy trends in e-cigarette export trade.
Trade Partners: 125
In November, China's e-cigarette trade involved 125 destination countries and regions, an increase of 3 from 122 trade partners last month.
Compared to the past three months, November added seven trade partners: Uganda, Malawi, the Federated States of Micronesia, Algeria, Syria, Qatar, and French Saint Martin; while it lost one trade partner, French Polynesia.
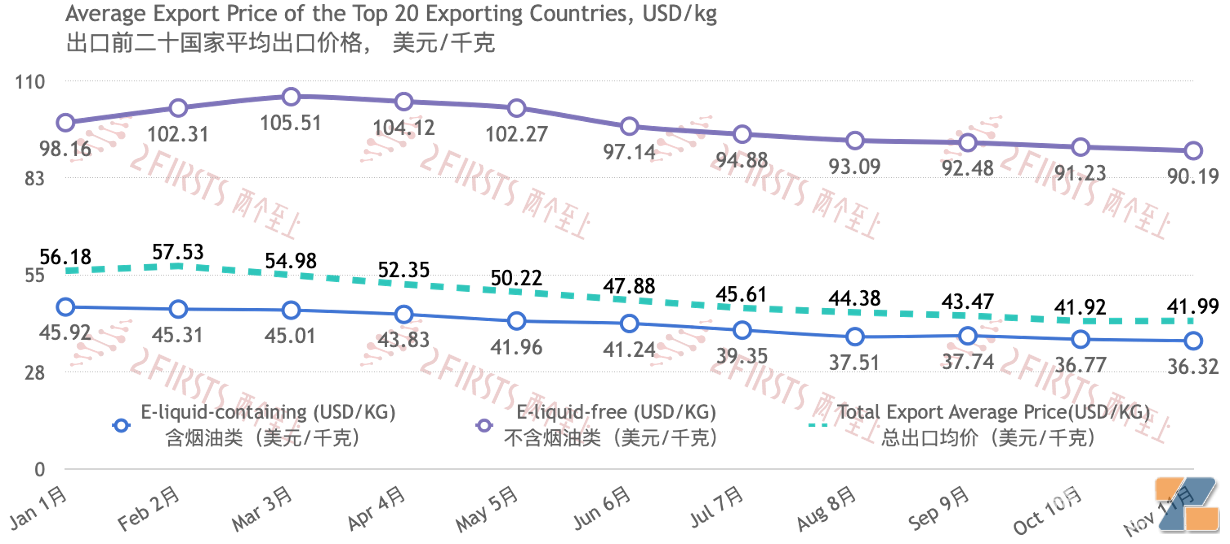
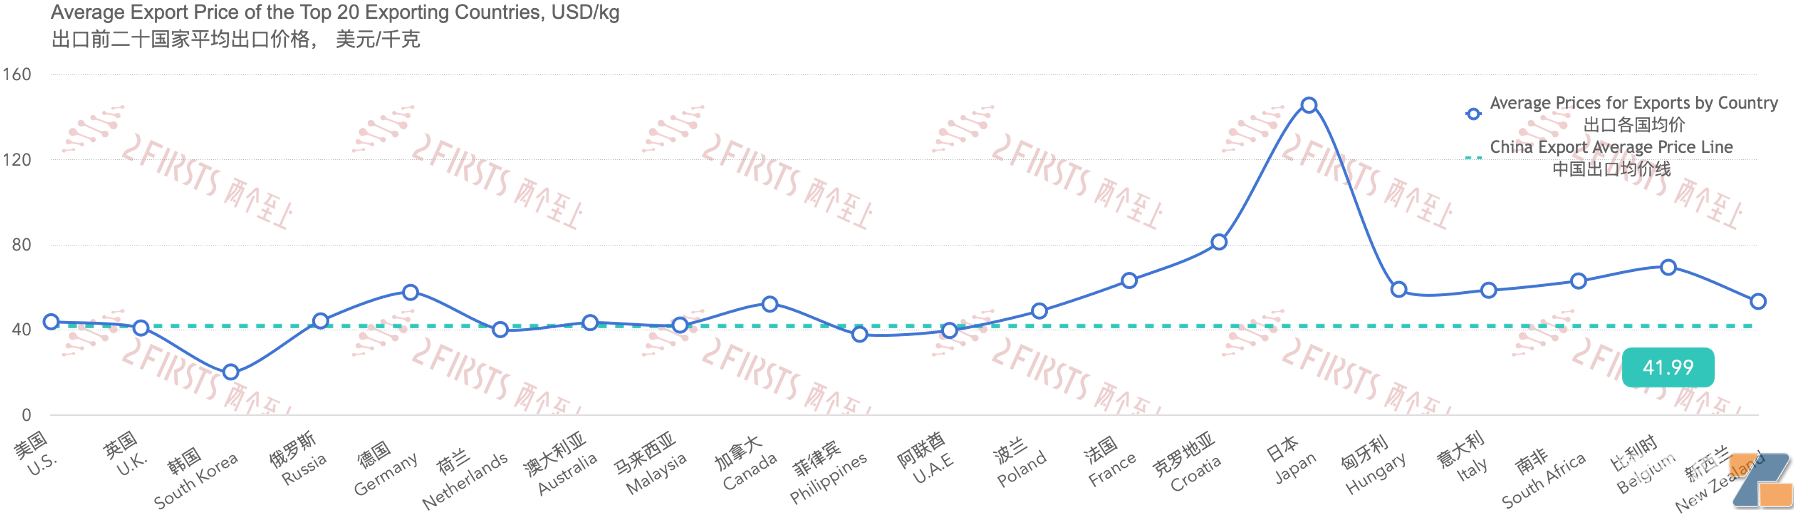
Export Prices: Expected to Stop Declining
In November, the average export price of Chinese e-cigarettes was $41.99/kg, an increase of 0.17% from the previous month, but a year-on-year decrease of 24.63%, marking the first increase in export prices since March this year.
The highest price destination was Turkey, at $201.96/kg; the lowest was Qatar, at $3.60/kg.
Among them, the average export price of e-liquids was $36.32/kg, a decrease of 1.22% from the previous month. The highest price destination was Bangladesh, at $115.26/kg; the lowest was Qatar, at $3.60/kg.
The average export price of non-e-liquid products was $90.19/kg, a decrease of 1.14% from the previous month; $4.86/unit, an increase of 0.79%. The highest price destination was Turkey, at $53.67/unit; the lowest was Cambodia, at $0.62/unit.
 Source: 2FIRSTS (Jiang Mingxi)
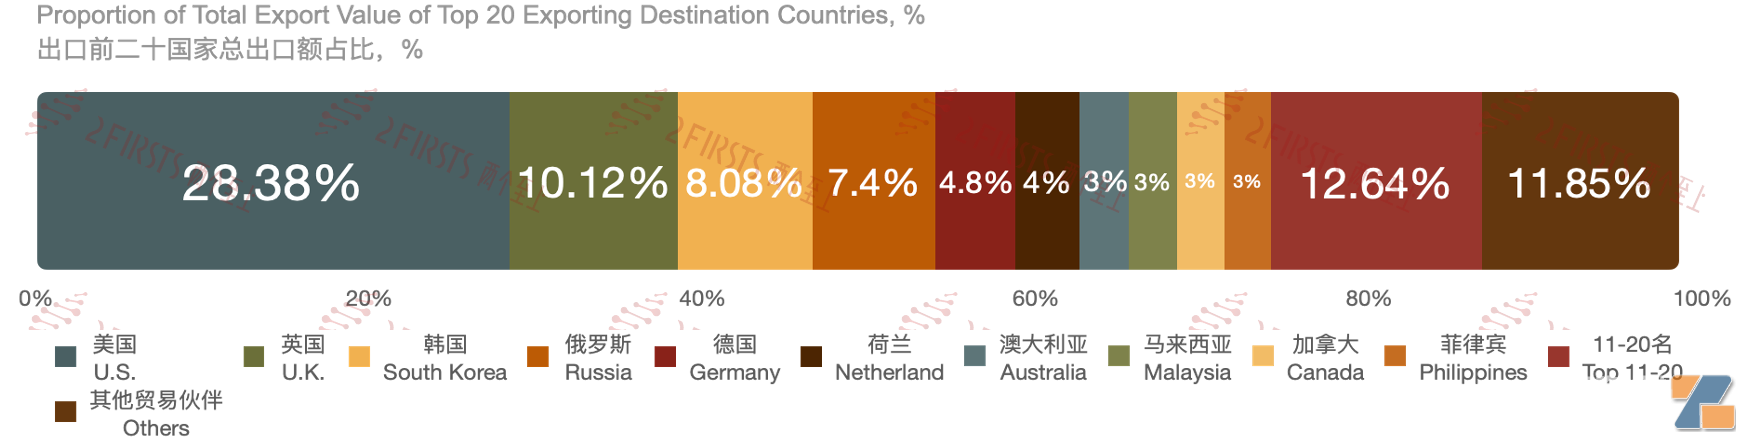
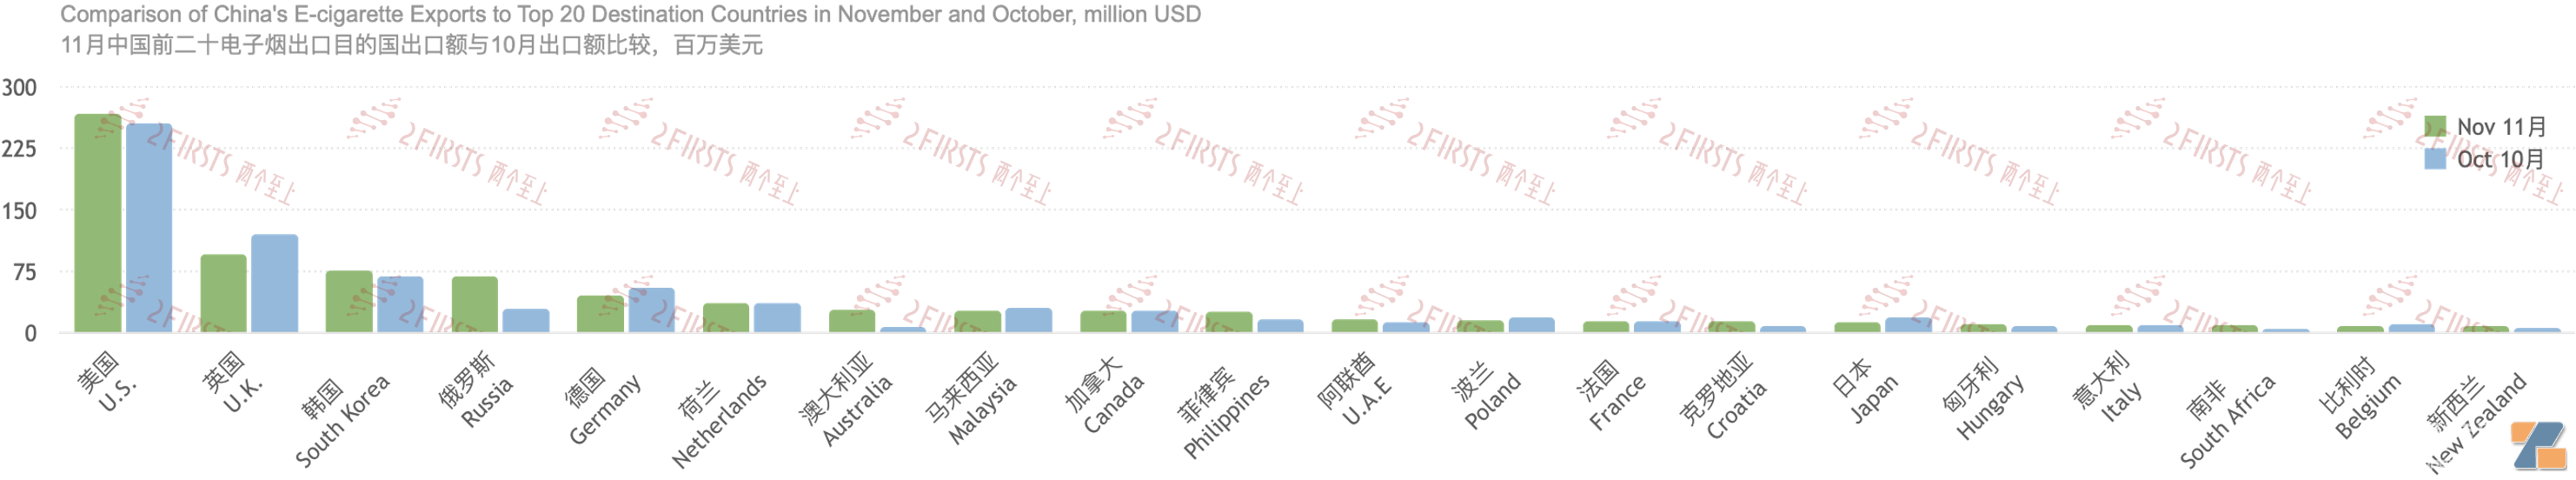
Export Market Concentration
In November, the top 10 countries by export value accounted for 74.09% of total exports, while the top 20 countries accounted for 86.74%.
Among them, the U.S. and the U.K. were the most stable, with the U.S. maintaining the top share at around 30%; the U.K. consistently held second place with about 10% share.
Currently, countries or regions undergoing regulatory policy changes (or with high levels of gray trade) show significant volatility, such as Russia and Australia.
In October, the top 10 countries by export value accounted for 76.08% of total exports, while the top 20 countries accounted for 88.31%.
The e-cigarette export market is showing a trend of diversification.
 Source: 2FIRSTS (Jiang Mingxi)
 Source: 2FIRSTS (Jiang Mingxi)
 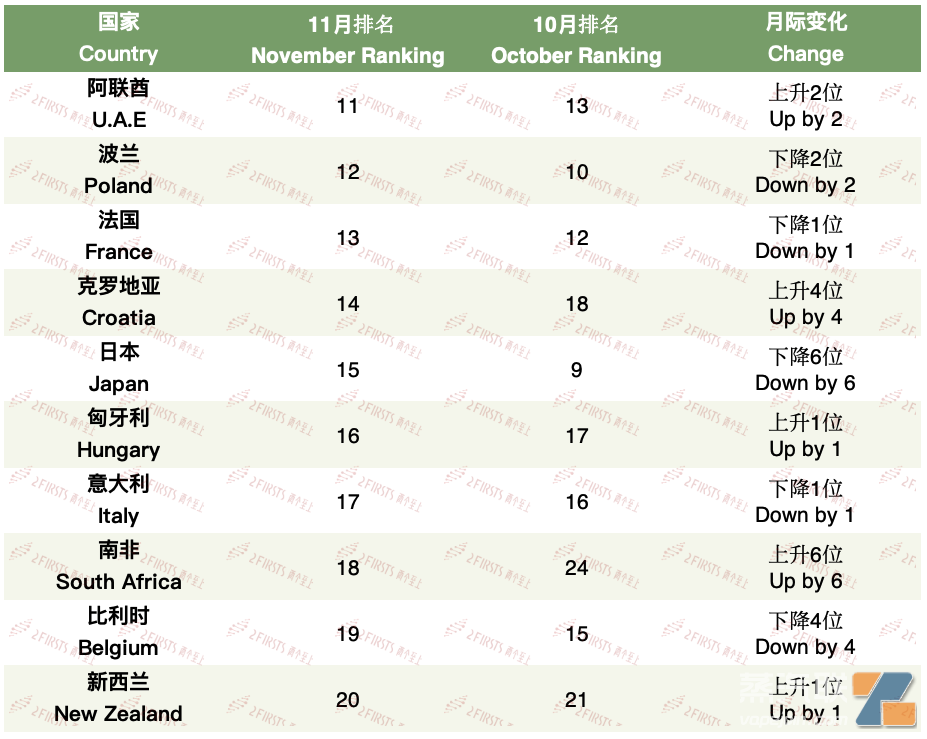 Source: 2FIRSTS (Jiang Mingxi)
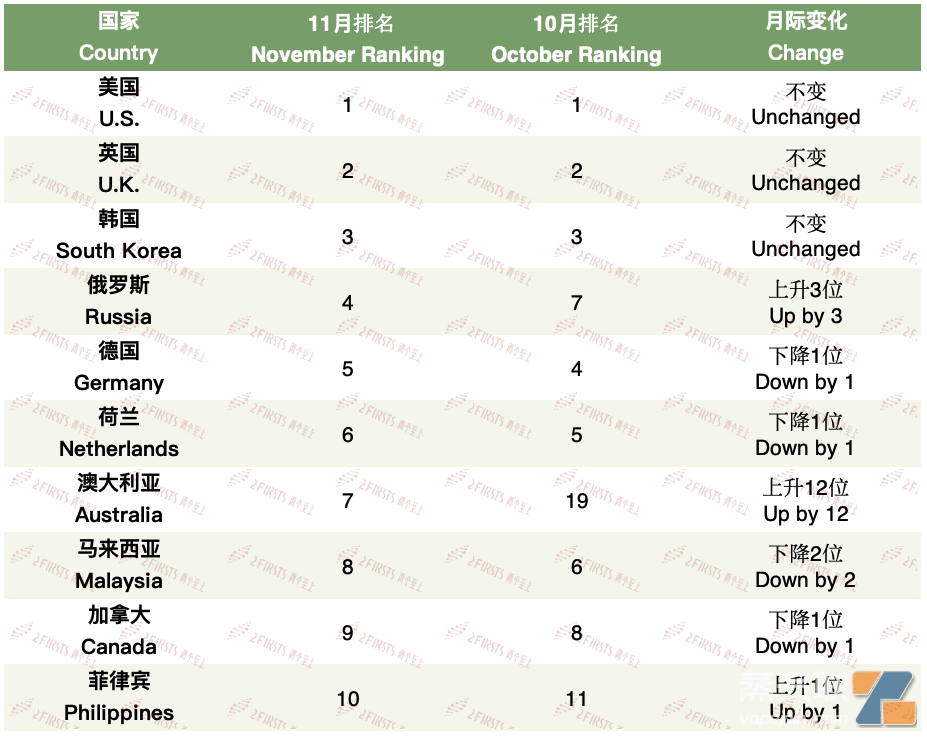
Monthly Changes in the Top Twenty Countries
In November, Australia saw the largest increase at 305.82%, followed by Russia and Croatia, with increases of 138.90% and 80.82%, respectively.
The U.K. experienced the largest decline, with export value decreasing by $25.155 million, a drop of 20.89%, followed by Japan and Belgium with declines of 30.55% and 24.19%, respectively.
 Source: 2FIRSTS (Jiang Mingxi)
Among the top 20 countries, Japan had the highest average unit price at $145.75/kg; South Korea had the lowest at $20.37/kg.
 Source: 2FIRSTS (Jiang Mingxi)
Data Explanation:
HS code 240412 refers to products that do not contain tobacco or reconstituted tobacco and are non-combustible products containing nicotine;
HS code 854340 refers to e-cigarettes and similar personal electronic vaporization devices. #p#分页标题#e#
Can be broadly classified as 240412 representing "e-liquid-containing" products, and 854340 representing "non-e-liquid-containing" products, with the above classifications used in this article.
Average export price = Total export value of China to country X / Total export volume of China to country X, measured in kilograms.
Average export price = Total export value of China to country X for "non-e-liquid-containing" products / Total export volume of China to country X for "non-e-liquid-containing" products, measured in units.